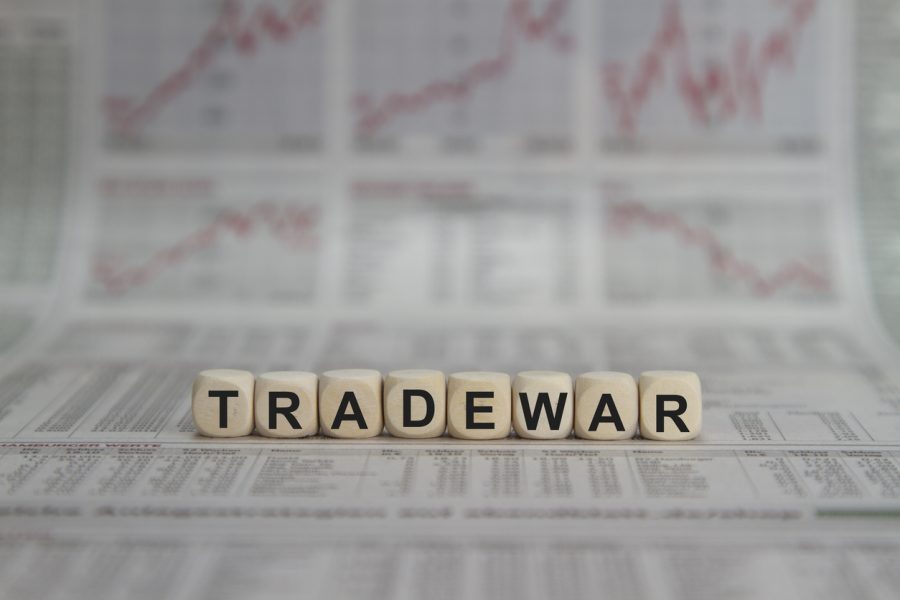
Could a Trade War Trigger the Next Recession?


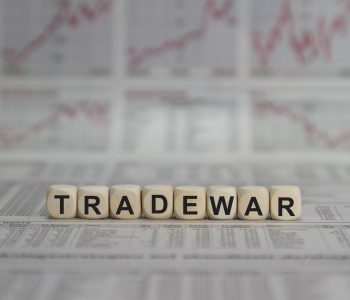
Should This Indicator Have Investors Worried?
One of the most common questions that family and friends ask me concerns the coming trade war and potential stock market crash in 2018.
“Countries around the world are putting up trade barriers,” one such person asked. “Do you think that could trigger a recession and market crash?”
And they’re not the only ones. After the U.S. slapped levies on $34.0 billion worth of Chinese exports in July, billionaire Ray Dalio of Bridgewater Associates, LP tweeted that, “Today is the first day of the war with China.” Thousands of analysts and economists have issued warnings of a looming trade war, drawing comparisons to the start of the Great Depression.
I tend to roll my eyes at the “Chicken Littles.” But several leading market indicators suggest that investors should be nervous right now. And if global trade skirmishes turn into a full-blown war, it could tip the United States into a full-blown recession.
Let me show you why with a simple market gauge. The gauge is called the “yield curve,” and it’s saying the risk of a recession is growing each day.
The yield curve is easy to wrap your head around. It simply shows the interest rate you have to pay to borrow money for various lengths of time. In a normal market, it’s more expensive to borrow money for longer periods. That makes sense, given it’s riskier to lend someone money for 10 years rather than one year. Lenders will demand a higher interest rate to compensate themselves for the uncertainty.
Normally, the difference between long- and short-term interest rates hovers around one percent; that represents the average over the last 50 years. So when the interest rate on a one-year government bond sits at 2.3%, as it is now, you’d expect the interest rates on a 10-year bond to be around 3.3% or so.
So that’s normal. Of course, the yield curve can move around quite a bit, depending on the outlook for the economy. If lenders feel optimistic and interest rates will likely rise, they’re not going to want to lock in today’s low yields, so borrowers will have to pay a larger premium for long-term loans. But if lenders feel worried about the economy and interest rates will likely fall, they’ll rush to lock in today’s higher yields, so borrowers will pay little to no premium to take out a long-term loan.
Market analysts love following the yield curve because it has a remarkable track record at predicting the economy. I’ve highlighted the spread between one-year and 10-year U.S. Treasury notes in the chart below. When the black line drops below zero, it means that short-term interest rates are above long-term interest rates. In all but one instance in which this phenomenon has happened over the past 50 years (1966 being the exception), a recession followed.
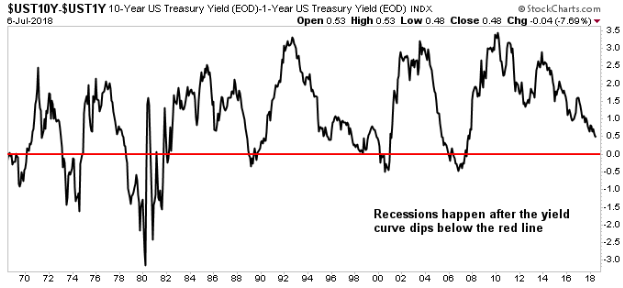
Chart courtesy of StockCharts.com
You can see the yield curve provided a warning for investors ahead of the 2000 tech bust. In late 1999, short-term interest rates rose above long-term rates. The economy entered a recession soon later, and the Nasdaq index plunged over 70%.
The same thing happened in 2006-2007. Lenders got worried about the economy and smart investors rushed to lock in high long-term interest rates. Then the Great Recession hit. The broader S&P 500 Index went on to plunge over 50%.
So, what is the yield curve telling us now? That the U.S. economy is getting weaker, but we’re not on the verge of a recession–yet. The spread between short- and long-term interest rates has dropped to its lowest level in years. The smart money sees the possibility of a downturn around the corner, so investors want to lock in a decent yield now.
And they have good reason to be nervous. Globalization has created a well-oiled diesel engine for the world economy. Throwing up trade barriers is the equivalent of filling up the tank with gasoline, putting on the handbrake, and never changing the oil for good measure. The thing is going to putter out eventually.
That said, the yield curve hasn’t signaled a full-blown recession yet. If you look through the history of the chart, we’ve seen that the spread between short- and long-term interest rates has dipped this low many times before. In fact, the spread sits at about the same level we saw in the mid-1990s. And last time I checked, that was a pretty good period for the U.S. economy.
Times feel really good out there. I know it; you can see it in the bustling shops and the “Now Hiring” signs around town. But a global trade war could end that boom. If you want to know for sure, keep an eye on the yield curve. This indicator has a fantastic track record. And if the spread dips below zero, it could signal that another recession is ahead.